Khamis, 30 Julai 2020
Dari Afrika Selatan ke Rusia
Rabu, 29 Julai 2020
SIVAGANGGA
Sivaganga (Tamil: [sɪʋəgəŋgəj])is a municipality in the Sivaganga district in the South Indian state of Tamil Nadu. It is also the headquarters of the Sivaganga District. The town is located at a distance of 48 km (30 mi) from Madurai and 449 km (279 mi) from the state capital Chennai. It is an important town in this district for official and commercial purposes. Its nickname was Sivaganga Seemai .
Sivaganga | |
|---|---|
Municipality | |
 Sivagangai Entrance Arch | |
| Nickname(s): Sivagangai Seemai | |
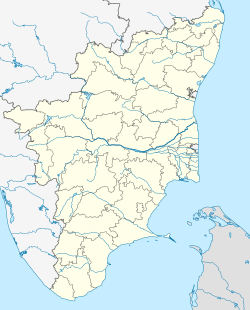
| Coordinates: 9.87°N 78.48°E | |
| Country | |
| State | Tamil Nadu |
| District | Sivagangai |
| Region | Pandya Nadu |
| Division | Madurai |
| Government | |
| • Type | selection Grade Municipality |
| • Body | Sivagangai Municipality |
| • Chairperson | Mr M.Arujunan B.A.[1] |
| • Vice Chairperson | Mr V.Sekar.[2] |
| • Commissioner of Municipality | Mr R.Subramanian B.COM.[3] |
| Area | |
| • Total | 10.2 km2 (3.9 sq mi) |
| Elevation | 102 m (335 ft) |
| Population (2011) | |
| • Total | 92,359 |
| • Density | 11,588/km2 (30,010/sq mi) |
| Languages | |
| • Official | Tamil |
| Time zone | UTC+5:30 (IST) |
| PIN | 630561,630562 |
| Telephone code | 04575 |
| Vehicle registration | TN-63 |
| Distance from Madurai | 40 kilometres (25 mi) WEST (Road) |
| Distance from Trichirapalli | 130 kilometres (81 mi) NORTH (Rail) |
| Distance from Rameswaram | 120 kilometres (75 mi) SOUTH (Rail) |
| Website | www |
Sivaganga kingdom was founded by Sasivarna Periya Oodaya Thevar in 1730. The town was subsequently ruled by his successors and ultimately by Velu Nachiyar under the stewardship of Maruthu Pandiyar. They were against the British Empire, but ultimately lost to them in 1790. The Company appointed Gowry Vallaba Periya Oodaya Thevar as the Zamindar of Sivaganga in 1801, whose successors continued with chaos until India's independence in 1947. It was under Ramnad district until 1984 and subsequently a part of the newly formed Sivaganga district. The town is known for agriculture, metal working and weaving. The region around Sivaganga has considerable mineral deposits.
Sivaganga is administered by a municipality established in 1965. As of 2011, the municipality covered an area of 7.97 km2 (3.08 sq mi) and had a population of 92,359 Sivaganga comes under the Sivaganga assembly constituency which elects a member to the Tamil Nadu Legislative Assembly once every five years and it is a part of the Sivaganga constituency which elects its Member of Parliament (MP) once in five years. Roadways are the major mode of transportation to the town and it also has rail connectivity. The nearest seaport, V. O. Chidambaranar Port Trust, Thoothukudi is located 189 km (117 mi) from Sivaganga, while the nearest airport, Madurai International Airport, is located 53 km (33 mi) from the town
Ahad, 19 Julai 2020
Yamaha FZ150i
Jumaat, 17 Julai 2020
TUNAI HAJI TAHUN 1924
Rabu, 8 Julai 2020
Marco Melgrati
Rabu, 1 Julai 2020
Patuh Syariat
CURI TANAH
CURI TANAH KUBUR SEBAGAI TABARRUK Kesan dari ajaran beberapa golongan 'ustaz' tentang hebatnya kubur itu, mulianya wali ini, bolehn...

-
Here is the sample from me to you you can copy and paste to Ms Word. For rider/driver going to Thailand using friend/company vehicles or ...
-
SENARAI PASAR MALAM DI KEDAH SENARAI PASAR MALAM DAERAH ALOR SETAR 1 Alor Setar Sabtu, Ahad, Isnin 5.00 Petang - 9.00 malam Seberang Jalan...


